
ES Weekly Ahead WC 9th November 2026
MARKET STRUCTURE
BEARISHSPOOBALANCE BREAKOVERLAPPING LOWERWEAK CLOSEINSIDE DAYNEWSCPI WEEK
Week Ahead Economic Events – CPI Week
All times ET.Sunday 8 November2 events · 0 high impact
| Time | F | Event | I | Actual | Forecast | Previous |
|---|---|---|---|---|---|---|
| 20:30 | CPI YoY (Oct) | – | 0.8% | 0.9% | ||
| 20:30 | PPI YoY (Oct) | – | 5.3% | 5.0% |
Monday 9 November13 events · 1 high impact · BoE Governor Bailey speaks
| Time | F | Event | I | Actual | Forecast | Previous |
|---|---|---|---|---|---|---|
| All day | Eurogroup and ECOFIN meetings | – | – | – | ||
| 02:00 | Trade Balance (Sep) | – | €19.4B | €19.5B | ||
| 08:40 | Fed Vice Chair Bowman speaks (community banking, Boston) | – | – | – | ||
| 10:00 | Wholesale Inventories MoM (Sep, final) | – | 0.6% | 0.5% | ||
| 10:00 | Fed Goolsbee moderated Q&A (Chicago) | – | – | – | ||
| 11:00 | NY Fed 1-Year Consumer Inflation Expectations (Oct) | – | 3.8% | 3.9% | ||
| 12:15 | Fed Barkin speaks (Greer, S.C.) | – | – | – | ||
| 12:30 | BoE Governor Bailey speaks | – | – | – | ||
| 13:00 | 3-Year Note Auction | – | – | 4.932% | ||
| 18:30 | Westpac Consumer Confidence Index (Nov) | – | 78.3 | 80.4 | ||
| 18:50 | BoJ Summary of Opinions (Oct meeting) | – | – | – | ||
| 19:30 | NAB Business Confidence (Oct) | – | -14 | -13 | ||
| 22:00 | Trade Balance (Oct) | – | $126.5B | $133.53B |
Tuesday 10 November15 events · 3 high impact · CPI MoM (Oct); Core CPI MoM (Oct); 10-Year Note Auction
Wednesday 11 November7 events · 1 high impact · Veterans Day: US bond market closed, equities open
| Time | F | Event | I | Actual | Forecast | Previous |
|---|---|---|---|---|---|---|
| All day | Veterans Day: US bond market closed, equities open | – | – | – | ||
| All day | Remembrance Day: Canadian bond market closed, equities open | – | – | – | ||
| 02:00 | CPI YoY (Oct, final) | – | 2.8% | 3.3% | ||
| 04:45 | ECB President Lagarde speaks | – | – | – | ||
| 18:50 | PPI YoY (Oct) | – | 6.5% | 6.8% | ||
| 19:00 | Melbourne Institute Consumer Inflation Expectations (Nov) | – | 5.4% | 5.3% | ||
| 20:30 | BoJ Asada speaks | – | – | – |
Thursday 12 November15 events · 3 high impact · GDP QoQ, preliminary (Q3); GDP MoM (Sep); 30-Year Bond Auction
| Time | F | Event | I | Actual | Forecast | Previous |
|---|---|---|---|---|---|---|
| 02:00 | GDP QoQ, preliminary (Q3) | – | 0.7% | 0.5% | ||
| 02:00 | GDP MoM (Sep) | – | 0% | 0.1% | ||
| 02:00 | Industrial Production MoM (Sep) | – | -0.4% | 0.8% | ||
| 08:30 | Building Permits MoM (Sep) | – | -3.9% | 8.8% | ||
| 08:30 | Initial Jobless Claims (week ended Nov 7) | – | 195K | 189K | ||
| 09:00 | Fed Hammack speaks | – | – | – | ||
| 10:00 | Existing Home Sales (Oct) | – | 3.98M | 3.99M | ||
| 10:00 | Fed Governor Barr speaks (AI and inequality, virtual) | – | – | – | ||
| 11:15 | Fed Goolsbee Q&A (Yahoo Finance Invest 2026, virtual) | – | – | – | ||
| 12:00 | EIA Crude Oil Inventories (week ended Nov 6, delayed from Wednesday) | – | – | -0.865M | ||
| 13:00 | 30-Year Bond Auction | – | – | 5.618% | ||
| 13:10 | Fed Daly keynote (SIEPR Policy Forum) | – | – | – | ||
| 14:00 | Monthly Treasury Statement (Oct) | – | $-298.0B | $-27B | ||
| 14:30 | ECB President Lagarde speaks | – | – | – | ||
| 18:30 | Fed Williams speaks | – | – | – |
Friday 13 November12 events · 2 high impact · PPI Final Demand MoM (Oct); Core PPI MoM, ex food and energy (Oct)
| Time | F | Event | I | Actual | Forecast | Previous |
|---|---|---|---|---|---|---|
| All day | New Yuan Loans (Oct) | – | CNY80B | CNY1080B | ||
| All day | Informal meeting of EU leaders (Dublin) | – | – | – | ||
| 02:45 | CPI YoY (Oct, final) | – | 3.4% | 3.1% | ||
| 05:00 | GDP QoQ, second estimate (Q3) | – | 0.4% | 0.4% | ||
| 05:00 | GDP YoY, second estimate (Q3) | – | 1.3% | 1.3% | ||
| 05:00 | Employment Change QoQ, preliminary (Q3) | – | 0.2% | 0.1% | ||
| 08:30 | PPI Final Demand MoM (Oct) | – | 0.4% | 1.3% | ||
| 08:30 | Core PPI MoM, ex food and energy (Oct) | – | 0.3% | 0.7% | ||
| 08:30 | Manufacturing Sales MoM (Sep) | – | 0.1% | 1.5% | ||
| 10:50 | Fed Vice Chair for Supervision Bowman speaks (Connecticut Bankers, virtual) | – | – | – | ||
| 12:00 | Fed Daly speaks (UNLV Economic Forecast) | – | – | – | ||
| 19:00 | Fed Vice Chair Jefferson speaks (productivity, UC San Diego) | – | – | – |
Next week: Empire State (Mon 16), retail sales and Nvidia earnings after the close (Tue 17), FOMC minutes 14:00 (Wed 18); monthly expiry Fri 20 Nov. The next FOMC is 8–9 December; CME FedWatch showed a 76.8% probability of a 25bp hike after Friday’s payrolls, up from 66.9% a week earlier, per CNBC and Yahoo Finance.
Key Macro Takeaways
- Post-election whipsaw. The Dow jumped about 1,500 points on Wednesday 4 November after the midterms, then fell about 1,800 on Thursday, CNBC reported. The S&P 500 closed Thursday at 7,353.73, down 4.4%, its worst day since April 2025, with all 11 sectors lower and the Nasdaq-100 down 6.4%, its worst since March 2020, Baird said. The Magnificent Seven shed about $1 trillion in one day, CNBC reported.
- The trigger was data-centre risk. Investors weighed what a Democratic sweep of Congress means for AI infrastructure build-out; UBS estimated about 30% of expected 2028 data-centre additions could be delayed, Baird reported. Yahoo Finance noted voters had approved more than 40 local ballot measures restricting data centres, while a presidential veto limits federal action.
- Hot payrolls, hike odds up. The Bureau of Labor Statistics said payrolls rose 165,000 in October against a consensus of roughly 59,000–70,000, unemployment 4.1%, average hourly earnings +0.4% m/m and 3.1% y/y; August and September were revised up by a combined 84,000. Reuters reported traders added to bets on a second hike in December. The S&P 500 rebounded 0.3% to 7,376.86 on Friday, the Nasdaq 1.1% to 24,579.42 (ThriveInMarkets, AP).
- Policy path. The Fed held at 3.75%–4.00% on 28 October, 10–2, with Governor Lisa Cook and Cleveland’s Beth Hammack dissenting in favour of a hike, after raising rates on 16 September. San Francisco’s Mary Daly said Friday further tightening is likely. The 2-year yield rose to 4.51% and the 10-year to 4.86%, with the dollar index up 0.7% on the report (Yahoo Finance).
- Cross-asset tell. VIX was around 24 Friday; CNBC’s Jay Woods wanted a move above 30 to call it a real flush. The put/call ratio hit 1.2 Thursday against a 0.6 average. WTI settled near $90.50 and Brent near $98 (ThriveInMarkets); Fidelity put WTI down 12.7% on the week.
KEY OUTLINE
DAILY: INSIDE DAY AFTER LIQUIDATION BREAK – WEAK CLOSE (OTF LOWER UNTIL 7469 IS ACCEPTED)
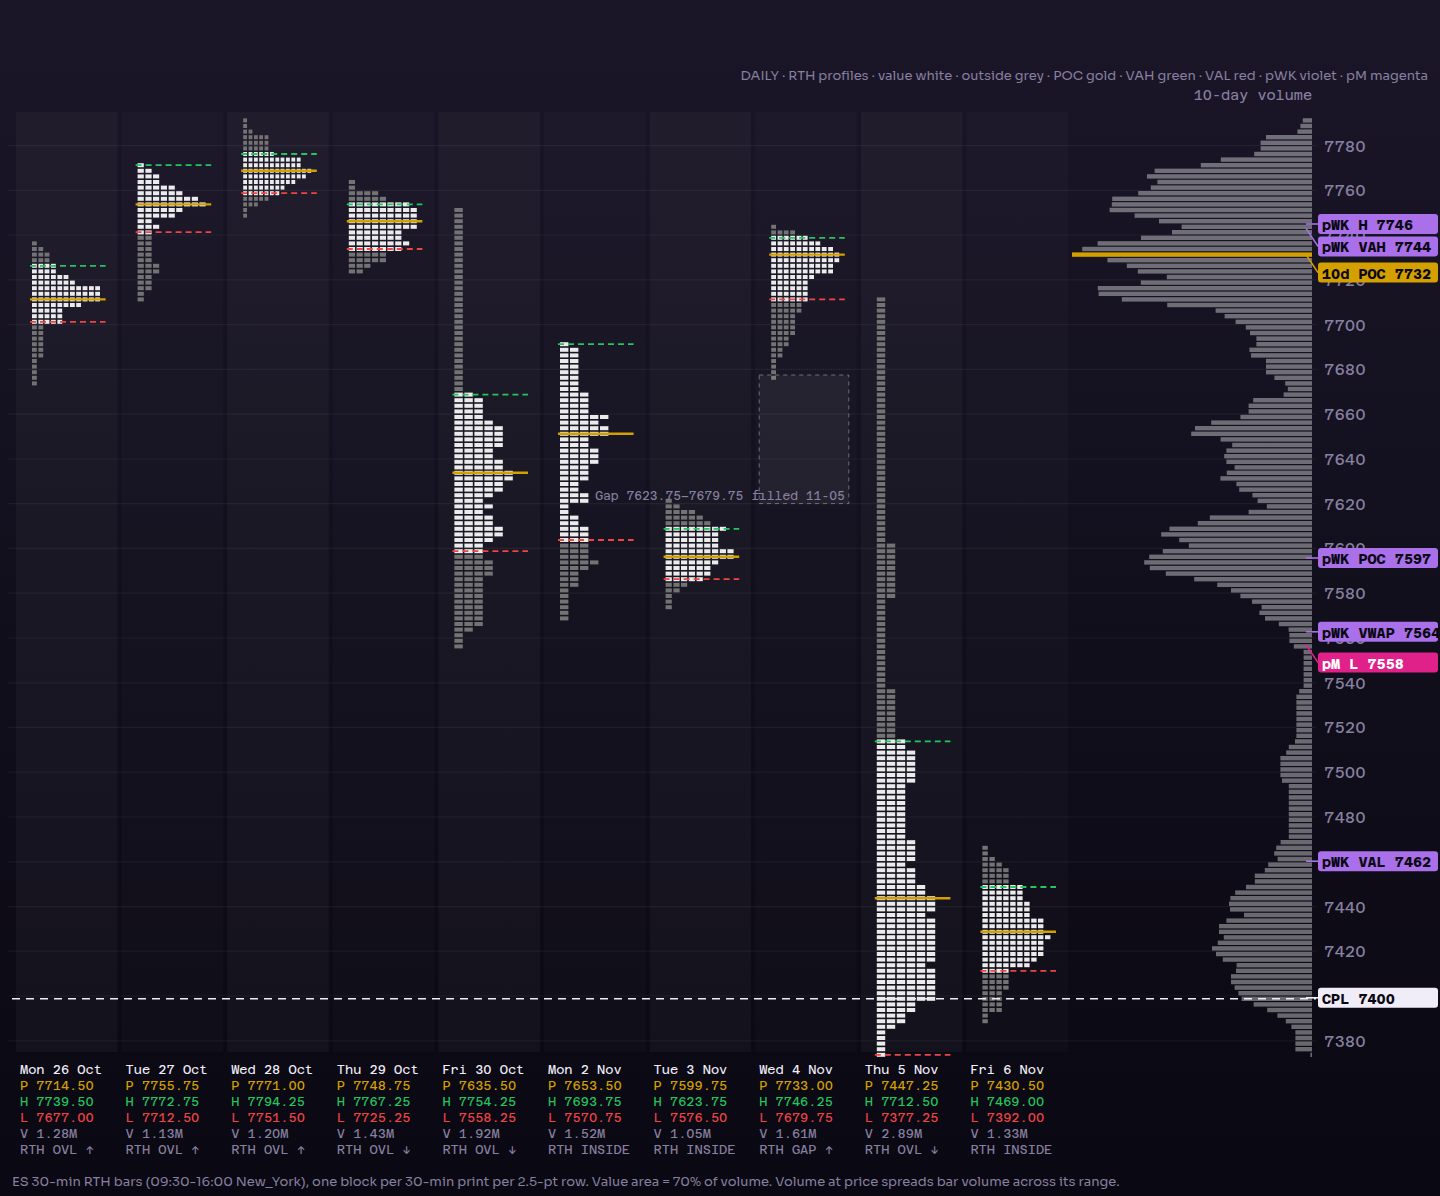
Chart 1 – last ten RTH sessions as TPO blocks: white in value, grey outside, POC gold, VAH green, VAL red; 10-day composite and prior-week levels at right.
- Fri 6 Nov (INSIDE DAY, NORMAL-DAY SHAPE). O 7394.50, H 7469.00, L 7392.00, C 7400.50. VPOC 7421.25, TPO POC 7430.50, VA 7413.50–7451.75, VWAP 7430.55. Volume 1.33M (46% of Thursday, 86% of the 10-day average of 1.54M), range 77. The whole range printed in the opening half hour (jobs-report spike to 7469, low 7392 at the open); initial balance equals the day range, no extension either way. Singles at both ends: 7465–7470 above, 7390–7395 below. The high sat on weekly VAL (7461.50) and was rejected. Last half hour sold 7425→7396.50 on 210K, closing 13.00 under the day’s VAL, in the bottom 11% of the range: WEAK CLOSE, back in overnight value.
- Overnight (ETH) Friday: H 7427.25, L 7322.25, VPOC 7397.25, VA 7383.50–7408.75. The 7322.25 low printed in the first half hour of the Thursday-night session and was never retested; RTH low was 7392.00, so the extreme is unconfirmed excess and is also the week low. RTH traded above the overnight high at the open (7469) but could not hold it.
- Thu 5 Nov (TREND DAY DOWN, OVERLAPPING LOWER). O 7707.50, H 7712.50, L 7377.25, C 7381.25 (1% off the low). VPOC 7401.25, TPO POC 7447.25, VA 7377.25–7515.75, VWAP 7486.39. Volume 2.89M, 1.9x the 10-day average, range 335.25. One-time-framing from the open: single prints 7605–7715 (tail from the high), interior singles 7540–7580, buying tail 7375–7390 at the low. IB 7498.00–7712.50. After the close the contract slipped to 7346.00 (ETH low), then recovered.
- Wed 4 Nov (TREND DAY UP, GAP UP). O 7683.00, H 7746.25, L 7679.75, C 7721.75, VPOC 7733.00, VA 7712.75–7740.75, volume 1.61M, range 66.50. Post-election overnight low 7490.00, then a 190-point rally to open 7683; gap 7623.75–7679.75 left open until Thursday’s sell-through (filled 5 Nov).
- Earlier sessions. Mon 2 Nov: O 7649.00, H 7693.75, L 7570.75, C 7576.25 (weak), VPOC 7653.50, range 123, overlapping higher vs the 30 Oct range. Tue 3 Nov: inside day, range 47.25 (7576.50–7623.75), 1.05M, the lowest volume of the ten sessions, VPOC 7599.25. Fri 30 Oct: gap down 7670.00–7725.25 at the open (filled 4 Nov), open-drive to 7558.25 on 1.92M, close 7612.75, VA 7594.50–7670.00. Before that, 26–29 Oct was balance 7677–7794 with VPOCs 7714–7770.
- Daily OTF. Thursday’s lower high (7712.50 vs 7746.25) started a one-time-framing lower; Friday’s inside day (high 7469.00, low 7392.00) leaves it intact. A trade above 7469.00 is the first break; acceptance back above 7515.75 (Thursday VAH) would be a rotation back into Thursday’s range. A trade below 7377.25 resumes the lower leg.
- Gaps. No open RTH gaps in the ten-day window. Closed: 4 Nov up-gap 7623.75–7679.75 (filled 5 Nov); 30 Oct down-gap 7670.00–7725.25 (filled 4 Nov).
- 10-day composite: POC 7732.50, VA 7587.50–7787.50. Price is 332 below composite POC and 187 below composite VAL.
WEEKLY: BALANCE BREAK LOWER – OVERLAPPING LOWER, WEAK CLOSE
Chart 2 – eight weeks: 24h candle and RTH volume profile, VPOC gold, VAH green, VAL red; composite and weekly references at right.
- Week of 2 Nov. 24h O 7632.00, H 7746.25, L 7322.25, C 7402.00; RTH O 7649.00, H 7746.25, L 7377.25, C 7400.50. Down 212.00 points (−2.78%) from the prior close of 7614.00. Range 424.00 against 261.25 and 163.75 in the two prior weeks, the widest of the eight weeks. Volume 11.06M, +24% vs the prior week (8.94M) and +25% vs the week before (8.88M).
- Structure. OVERLAPPING LOWER vs the 26 Oct week (H 7819.50, L 7558.25). It broke the eight-week balance floor (7558.25 on 30 Oct; 7575.00 on 16 Sep) and closed 156 points under it. Weekly lows have stepped down four weeks running: 7760.25 → 7676.00 → 7648.50 → 7558.25 → 7322.25; weekly closes are lower four weeks in a row (7859.75 → 7704.25 → 7659.75 → 7614.00 → 7402.00).
- Value and close. VPOC 7597.00, VA 7461.50–7744.25 (wide and bimodal), VWAP 7563.97, mid 7534.25. The close is 59.50 below VAL, 162 below VWAP, 195 below VPOC and 80 above the week low (bottom 19% of the range): WEAK CLOSE, outside value, below VWAP.
- Where the volume is. Two distributions. Upper: Mon–Wed (VPOCs 7653.50, 7599.25, 7733.00; HVN at 7736 on the RTH profile). Lower: Thu–Fri (VPOCs 7401.25, 7421.25; RTH HVN 7419). Between them an air pocket: Thursday’s singles 7540–7580 and the single-print tail 7605–7715. Little volume traded between 7515.75 (Thu VAH) and 7589.25 (Tue VAL).
- Extremes. Low: RTH buying tail 7375–7390, but the 24h low 7322.25 was an overnight excess that RTH did not confirm. High: 7746.25 on Wednesday, 73 points under the 2WK high (7819.50); the post-election gap-up was fully reversed, an upside rotation that failed inside the old range.
- Preceding weeks. The eight weeks from 14 Sep to 30 Oct were balance, 7558–7897 (RTH composite POC 7770.00, VA 7650.00–7812.50); the 5 Oct week made the high (7897.50, 6 Oct) and every week since has closed lower. 2WK (26 Oct week): H 7819.50, L 7558.25, VPOC 7755.75, VA 7685.75–7787.25 — now all overhead.
- Weekly VWAP sequence: 7679 (14 Sep) → 7791 → 7746 → 7837 (5 Oct) → 7786 → 7732 → 7712 → 7564. Last week’s VWAP dropped 148 points, the largest fall in the series.
- pWK references: H 7746.25, L 7322.25, VPOC 7597.00, VAH 7744.25, VAL 7461.50, VWAP 7563.97, mid 7534.25.
MONTHLY: BALANCE BREAK LOWER (NOVEMBER MTD OUTSIDE BELOW pM LOW)
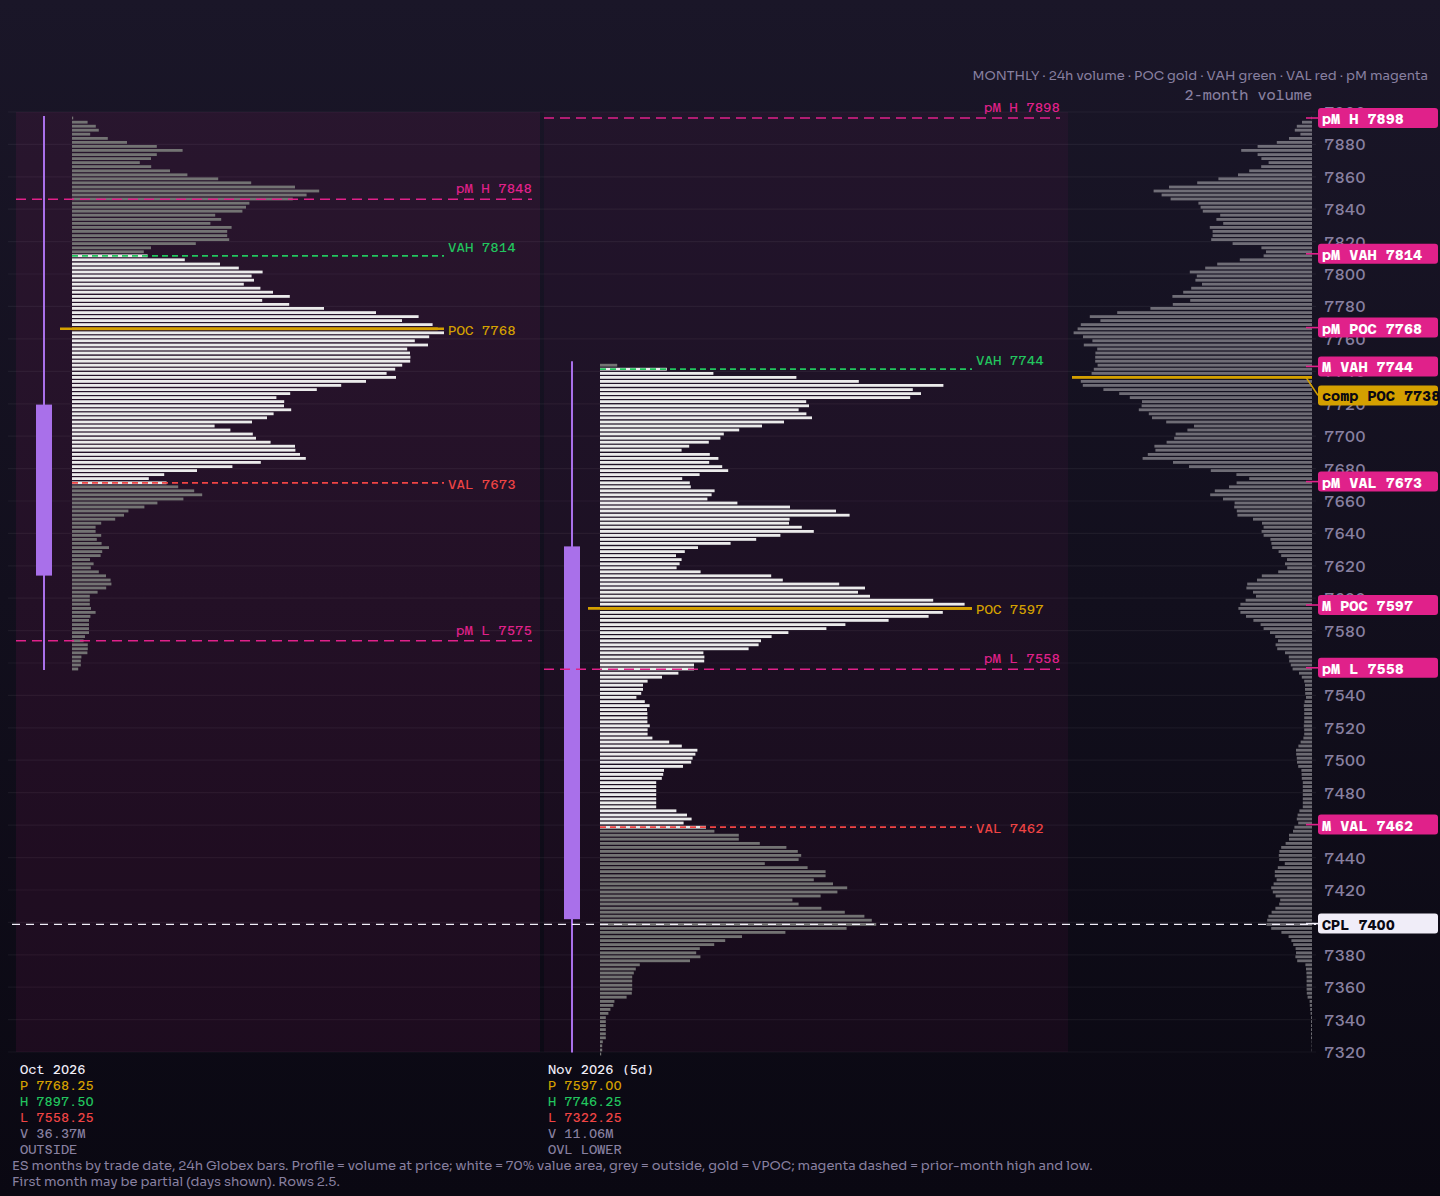
Chart 3 – October and November-to-date, 24h profiles with the prior-month high and low carried forward.
- October (22 sessions, OUTSIDE month vs September, balance within it). O 7719.50, H 7897.50 (6 Oct), L 7558.25 (30 Oct), C 7614.00. VPOC 7768.25, VA 7672.25–7813.75, VWAP 7759.29, mid 7727.88, volume 36.37M. September: O 7769.00, H 7848.50, L 7575.00, C 7721.50, VPOC 7743.25, VA 7681.75–7793.75, VWAP 7737.74, 31.92M.
- November MTD (5 sessions). O 7632.00, H 7746.25, L 7322.25, C 7402.00; VPOC 7597.00, VA 7461.50–7744.25, VWAP 7563.97, 11.06M, about 2.2M a day against 1.65M in October. The month has traded 236 below the pM low (7558.25) and sits 156 under it; the pM high 7897.50 is 495 above.
- Three-month composite: POC 7765.00, VA 7657.50–7807.50. The close is 255 below the composite VAL, a monthly-timeframe auction away from value on a volume spike, not yet on repeated acceptance.
- Longer references (daily bars). All-time high 7897.50 on 6 Oct (the close is 6.3% below it). Lower references: 7575.00 (16 Sep low), 7672.75 (1 Oct low). Beneath current trade the Q2–Q3 swing-low shelf from the then-front-month contract: 7324.00 (29 Jul), 7357.25 (26 Jun), 7354.25 (19 May), with 7232.25 (11 Jun) below; these are unadjusted for the quarterly rolls, so their December-contract equivalents sit higher. The week low of 7322.25 sits at the same shelf.
- Alignment. Daily (inside, weak close), weekly (balance break, close below VAL/VWAP) and monthly (MTD below pM low) all point lower; the offset is that Friday’s inside day and the unconfirmed overnight low give the first responsive-buyer evidence near 7322–7392.
Weekly Summary
- Headline: ES fell 212 points (−2.78%) to 7402.00, a Thursday liquidation (−4.4% in the S&P 500) bracketed by an election pop and a payrolls bounce.
- High/low: 7746.25 (Wed 4 Nov RTH); low 7322.25 (Thu-night Globex), RTH low 7377.25 (Thu 5 Nov).
- Value/VPOC/VWAP: VA 7461.50–7744.25, VPOC 7597.00, VWAP 7563.97; close below all three.
- Range/volume: 424 points, 11.06M, +24% on the prior week.
- Last day: inside day, 7392.00–7469.00, high rejected at weekly VAL, weak close 7400.50.
- Classification: balance break lower from an eight-week 7558–7897 range, overlapping lower, weekly OTF lower.
Summary
Weekly Structure & Market Context
ES spent eight weeks in a 7558–7897 range (composite POC 7770) and rolled over from the 6 October all-time high of 7897.50. The post-election rally on Wednesday carried to 7746.25 and filled the 30 October gap down (7670.00–7725.25), then the market reversed: Thursday’s 4.4% S&P 500 drop on data-centre and AI-infrastructure fears took ES from 7707.50 to 7377.25 on 2.89M, a one-way trend day with 110 points of single prints from the open. That was the break of the balance, and the first time in the eight weeks that the market has built value outside it.
The profile says the market is auctioning between two value areas with air between them. New value sits at 7377–7516 (Thursday) and 7392–7469 (Friday, VPOC 7421). Above, the 7540–7580 singles and the 7605–7715 tail are un-traded; the next real volume is the Tuesday VPOC at 7599 and the weekly VWAP at 7564. Friday did not repair any of it: it spiked on payrolls to 7469, stalled at weekly VAL (7461.50), and gave it back into a weak close that matched overnight value.
The line in the sand below is 7377.25 (Thursday’s low and VAL, the 7375–7390 buying tail) and, below it, the overnight low 7322.25. Below 7322.25 there is no Q4 value to lean on. The line above is the weekly VAL / Friday high zone, 7461.50–7469.00; beyond that, Thursday’s VAH 7515.75 and the weekly mid 7534.25.
Bullish case (responsive): price holds the 7377–7392 shelf, takes back Friday’s VWAP (7430.55) and VAH (7451.75), and accepts above 7469 for two or more 30-minute periods. That turns Friday’s range into a base and invites a rotation back through the weekly VAL toward the singles. The test is initiative: acceptance above 7515.75 with volume would put Thursday’s range back in play. A reclaim of 7564 (weekly VWAP, pM low at 7558.25) is needed to argue that the break was a look-below-and-fail.
Bearish case (initiative): continuation below 7392.00 and 7377.25 with a lower close than Thursday’s 7381.25 would confirm acceptance outside the balance, with 7346.00 and 7322.25 the immediate magnets and the Q2–Q3 swing-low shelf (7324–7357) the next test. A second inside day followed by a break would fit the one-time-framing lower.
Event timing: CPI on Tuesday 10 November at 08:30 ET is the binary event, with the Treasury market closed Wednesday and the 3-, 10- and 30-year auctions Monday, Tuesday and Thursday. A hot print adds to a December hike priced at about 77%, after the tech sell-off; PPI follows Friday 08:30. Nvidia earnings (Tue 17 Nov) are the following week’s tech event.
Key Technical Levels
| TF | Price | Level | From close |
|---|---|---|---|
| ▲ M | 7,897.50 | pM high | +495.50 (+6.69%) |
| △ W | 7,819.50 | 2WK high | +417.50 (+5.64%) |
| ▲ M | 7,813.75 | pM VAH | +411.75 (+5.56%) |
| ▲ M | 7,768.25 | pM VPOC | +366.25 (+4.95%) |
| ▲ M | 7,759.29 | pM VWAP | +357.29 (+4.83%) |
| △ W | 7,755.75 | 2WK VPOC | +353.75 (+4.78%) |
| △ W | 7,746.25 | Week high | +344.25 (+4.65%) |
| △ W | 7,744.25 | Week VAH · Month-to-date VAH | +342.25 (+4.62%) |
| ◁ P | 7,712.50 | Thu 5 Nov high | +310.50 (+4.19%) |
| ▲ M | 7,673.25 | pM VAL | +271.25 (+3.66%) |
| △ W | 7,597.00 | Week VPOC · Month-to-date VPOC | +195.00 (+2.63%) |
| △ W | 7,563.97 | Week VWAP · Month-to-date VWAP | +161.97 (+2.19%) |
| △ W | 7,558.25 | 2WK low · pM low | +156.25 (+2.11%) |
| △ W | 7,534.25 | Week mid | +132.25 (+1.79%) |
| ◁ P | 7,515.75 | Thu 5 Nov VAH | +113.75 (+1.54%) |
| ◁ P | 7,486.39 | Thu 5 Nov VWAP | +84.39 (+1.14%) |
| ◁ P | 7,469.00 | Fri 6 Nov high | +67.00 (+0.91%) |
| △ W | 7,461.50 | Week VAL · Month-to-date VAL | +59.50 (+0.80%) |
| ◁ P | 7,451.75 | Fri 6 Nov VAH | +49.75 (+0.67%) |
| ◁ P | 7,430.55 | Fri 6 Nov VWAP | +28.55 (+0.39%) |
| ○ E | 7,427.25 | Overnight high (Fri 6 Nov) | +25.25 (+0.34%) |
| ◁ P | 7,421.25 | Fri 6 Nov VPOC | +19.25 (+0.26%) |
| ◁ P | 7,413.50 | Fri 6 Nov VAL | +11.50 (+0.16%) |
| ■ CLOSE | 7,402.00 | WEEK CLOSE | — |
| ◁ P | 7,401.25 | Thu 5 Nov VPOC | -0.75 (-0.01%) |
| □ RTH | 7,400.50 | Last RTH close (Fri 6 Nov) | -1.50 |
| ◁ P | 7,392.00 | Fri 6 Nov low | -10.00 (-0.14%) |
| ◁ P | 7,377.25 | Thu 5 Nov low · Thu 5 Nov VAL · Week RTH low | -24.75 (-0.33%) |
| ○ E | 7,322.25 | Overnight low (Fri 6 Nov) · Week low | -79.75 (-1.08%) |
Edge = timeframe: ◁ P prior sessions · ○ E overnight · △ W weekly · ▲ M monthly · ◇ G open gap. Dot = level type: POC · VAH · VAL · VWAP; larger dot = more important. From close: above in red, below in green.
Bearish scenario (if 7392.00 and 7377.25 fail and the price accepts below Friday’s value):
- Initial: 7392.00 (Fri low), 7377.25 (Thu low, Thu VAL, RTH week low; buying tail 7375–7390).
- Key test: 7346.00 (Thu post-close low), 7322.25 (week low and Thu-night excess).
- Below: Q2–Q3 swing-low shelf 7324.00 (29 Jul), 7354–7357 (19 May, 26 Jun, unadjusted front-month), then 7232.25 (11 Jun).
Bullish scenario (if Friday’s VAL 7413.50 holds and price accepts above Friday’s VAH):
- Initial resistance: 7430.55 (Fri VWAP), 7451.75 (Fri VAH), 7461.50 (weekly VAL), 7469.00 (Fri high).
- Then: 7486.39 (Thu VWAP), 7515.75 (Thu VAH), 7534.25 (weekly mid), 7540–7580 singles.
- Higher targets: 7558.25 (pM low / 2WK low) and 7563.97 (weekly and MTD VWAP), 7597.00 (weekly VPOC), 7605–7715 Thursday tail, 7672.25 (pM VAL), 7712.50 (Thu high), 7744–7746 (weekly VAH and high).
Key levels to watch
- 7461.50–7469.00: weekly VAL and Friday’s high; reclaim turns Friday into a base.
- 7392.00 / 7377.25: Friday low and Thursday low/VAL; below them the one-time-framing lower resumes.
- 7322.25: week low and the overnight excess; the line between a balance break and a trend continuation.
- 7563.97 / 7558.25: weekly VWAP and the pM/2WK low; a reclaim here would say the break was a look-below-and-fail.
- 7597.00: weekly VPOC, the volume magnet in the air pocket above.
Market is below value on the daily, weekly and monthly timeframes, with a thin zone overhead (7540–7715) and CPI on Tuesday; risk management matters around the 7377 and 7469 edges where Friday’s range is defined.
Data note: ES continuous futures, 30-minute bars, RTH 09:30–16:00 ET (Globex day rolls 18:00 ET); volume at price approximated by spreading each bar’s volume evenly across its high–low range; value area 70% around the volume POC; TPO POC is the row with the most 30-minute prints. Bars before the 14 September contract roll are adjusted by +67.75 to the December contract. Not investment advice.
TECHNICAL
Trend: DOWNTREND (short term, inside a longer uptrend)MA stack: bearish, below the 5/20/50/100, above the 200Momentum: weak, RSI 34.5
ES, week commencing Monday 9 November 2026 (prepared Sunday 8 November)
Trend and moving averages

The 7402.00 close is below SMA 5 at 7535.35 (-1.77%), SMA 20 at 7696.73 (-3.83%), SMA 50 at 7714.70 (-4.05%) and SMA 100 at 7654.04 (-3.29%), and 0.65% above SMA 200 at 7354.37. Stack from the top: 50, 20, 100, 5, 200. The 5, 20 and 50 are falling (5-day slopes -189.50, -77.61, -16.17); the 100 and 200 still rise (+4.88, +15.17). The 20-day crossed below the 50-day on 5 November; the 5-day crossed below the 20-day on 19 October. Price last crossed above the 200-day on 8 April and has not closed below it since.
Momentum and volume

RSI(14): 34.5 daily and 36.2 on the 4-hour; weak, not oversold. Volume expanded Wednesday 4 November (2,412,784) and peaked Thursday 5 November (3,542,881 against a 20-day average of 2,008,760). Weekly volume of 11,057,381 compares with 8,942,025 and 8,882,562 in the prior two weeks. Friday’s regular-hours volume fell to 1,327,025 from 2,893,197.
The week on the 5-minute chart
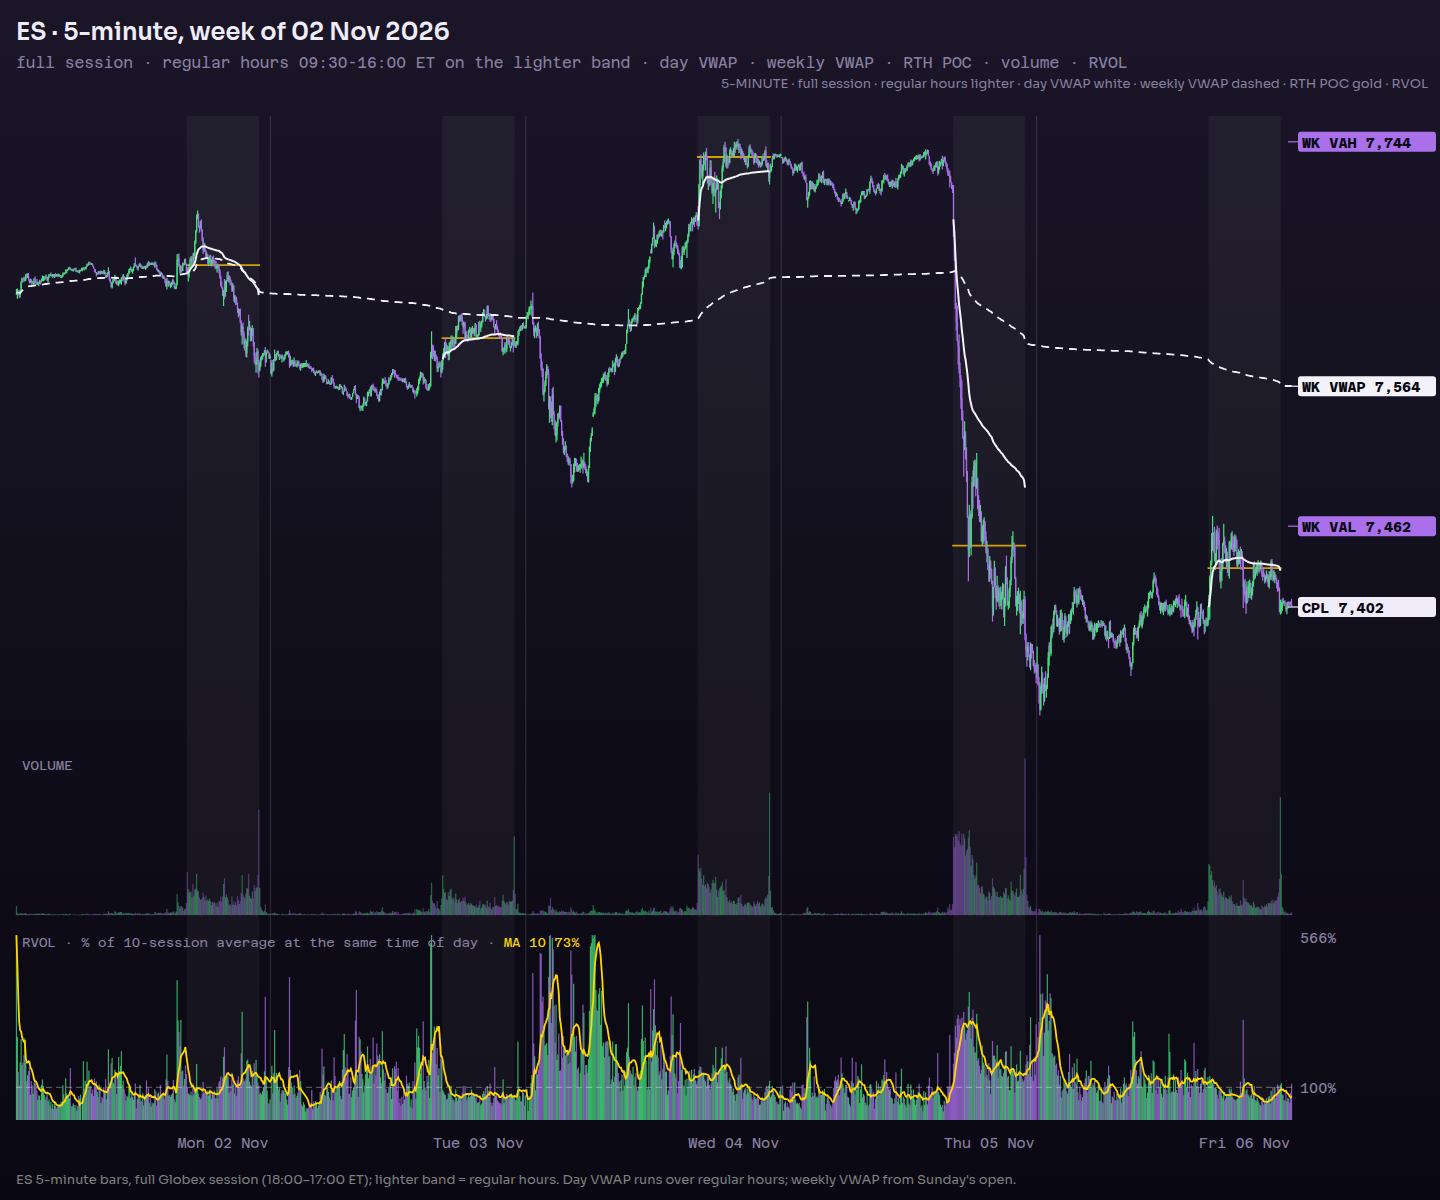
- Mon: opened 7649.00 inside the overnight range, hit 7693.75 in the first hour, slid below VWAP and closed at the low, 7576.25.
- Tue: opened 7580.00 mid-range and rotated around VWAP (7600.90); narrowest range (47 points); closed 7596.50.
- Wed: opened 7683.00 near the top of the overnight range, above Tuesday’s high. Broke the first-hour high 7739.75, held VWAP as support and closed 7721.75.
- Thu: opened 7707.50, the high of the day, and filled Wednesday’s gap. Broke the first-hour low 7498.00, never closed above VWAP (7489.88) and finished 7381.25.
- Fri: opened 7394.50 in the upper half of the overnight range (7322.25-7427.25), stayed inside the first-hour range (7392.00-7469.00), traded mostly under VWAP (7428.67) and closed 7400.50.
Key technical levels
| Price | Level | Why |
|---|---|---|
| 7897.50 | 52-week high, October high | 6 October peak |
| 7819.50 | 2WK high | Two-week top |
| 7744.25 | Last week VAH | Top of value |
| 7714.70 | SMA 50 | Highest average |
| 7696.73 | SMA 20 | Falling |
| 7654.04 | SMA 100 | Rising |
| 7597.00 | Last week POC | Most traded |
| 7563.97 | Last week VWAP | Average price |
| 7558.25 | October low | Prior-month low |
| 7535.35 | SMA 5 | Resistance |
| 7461.50 | Last week VAL | Bottom of value |
| 7402.00 | Last close | Friday |
| 7354.37 | SMA 200 | Trend line |
| 7322.25 | 2WK low, week low | Friday overnight low |
| 6353.25 | 52-week low | 31 March |
Scenarios
Bullish: the 200-day and 7322.25 hold and price reclaims 7461.50, then 7563.97 and 7597.00. Daily closes above 7654.04-7714.70 would repair the stack; 7744.25 is next. Rejection at 7461.50 weakens it.
Bearish: a daily close below 7354.37 and 7322.25, the first under the 200-day since April, opens 7232.25 (June low). Rejection at 7535.35-7563.97 would keep sellers in control.
Data: continuous front-month ES futures bars to the 6 November 2026 close.
General market information and analysis only. Not investment advice or a recommendation to buy or sell. Content may be inaccurate or out of date, and prices may be delayed.
Get the journal in your inbox
The daily journal, the week reviews and the Weekly Ahead, by email. Subscribers get the pre-market update first.